Usage & Costs Dashboard
Pinchy keeps a running tally of how many tokens each agent burns through and what they roughly cost. The Usage Dashboard at /usage is where admins go to answer "where is the money going" without leaving the platform or stitching together provider invoices.
Who can see it
Section titled “Who can see it”Admins only. Non-admin users get redirected to the home page if they try to open /usage directly.
What you see
Section titled “What you see”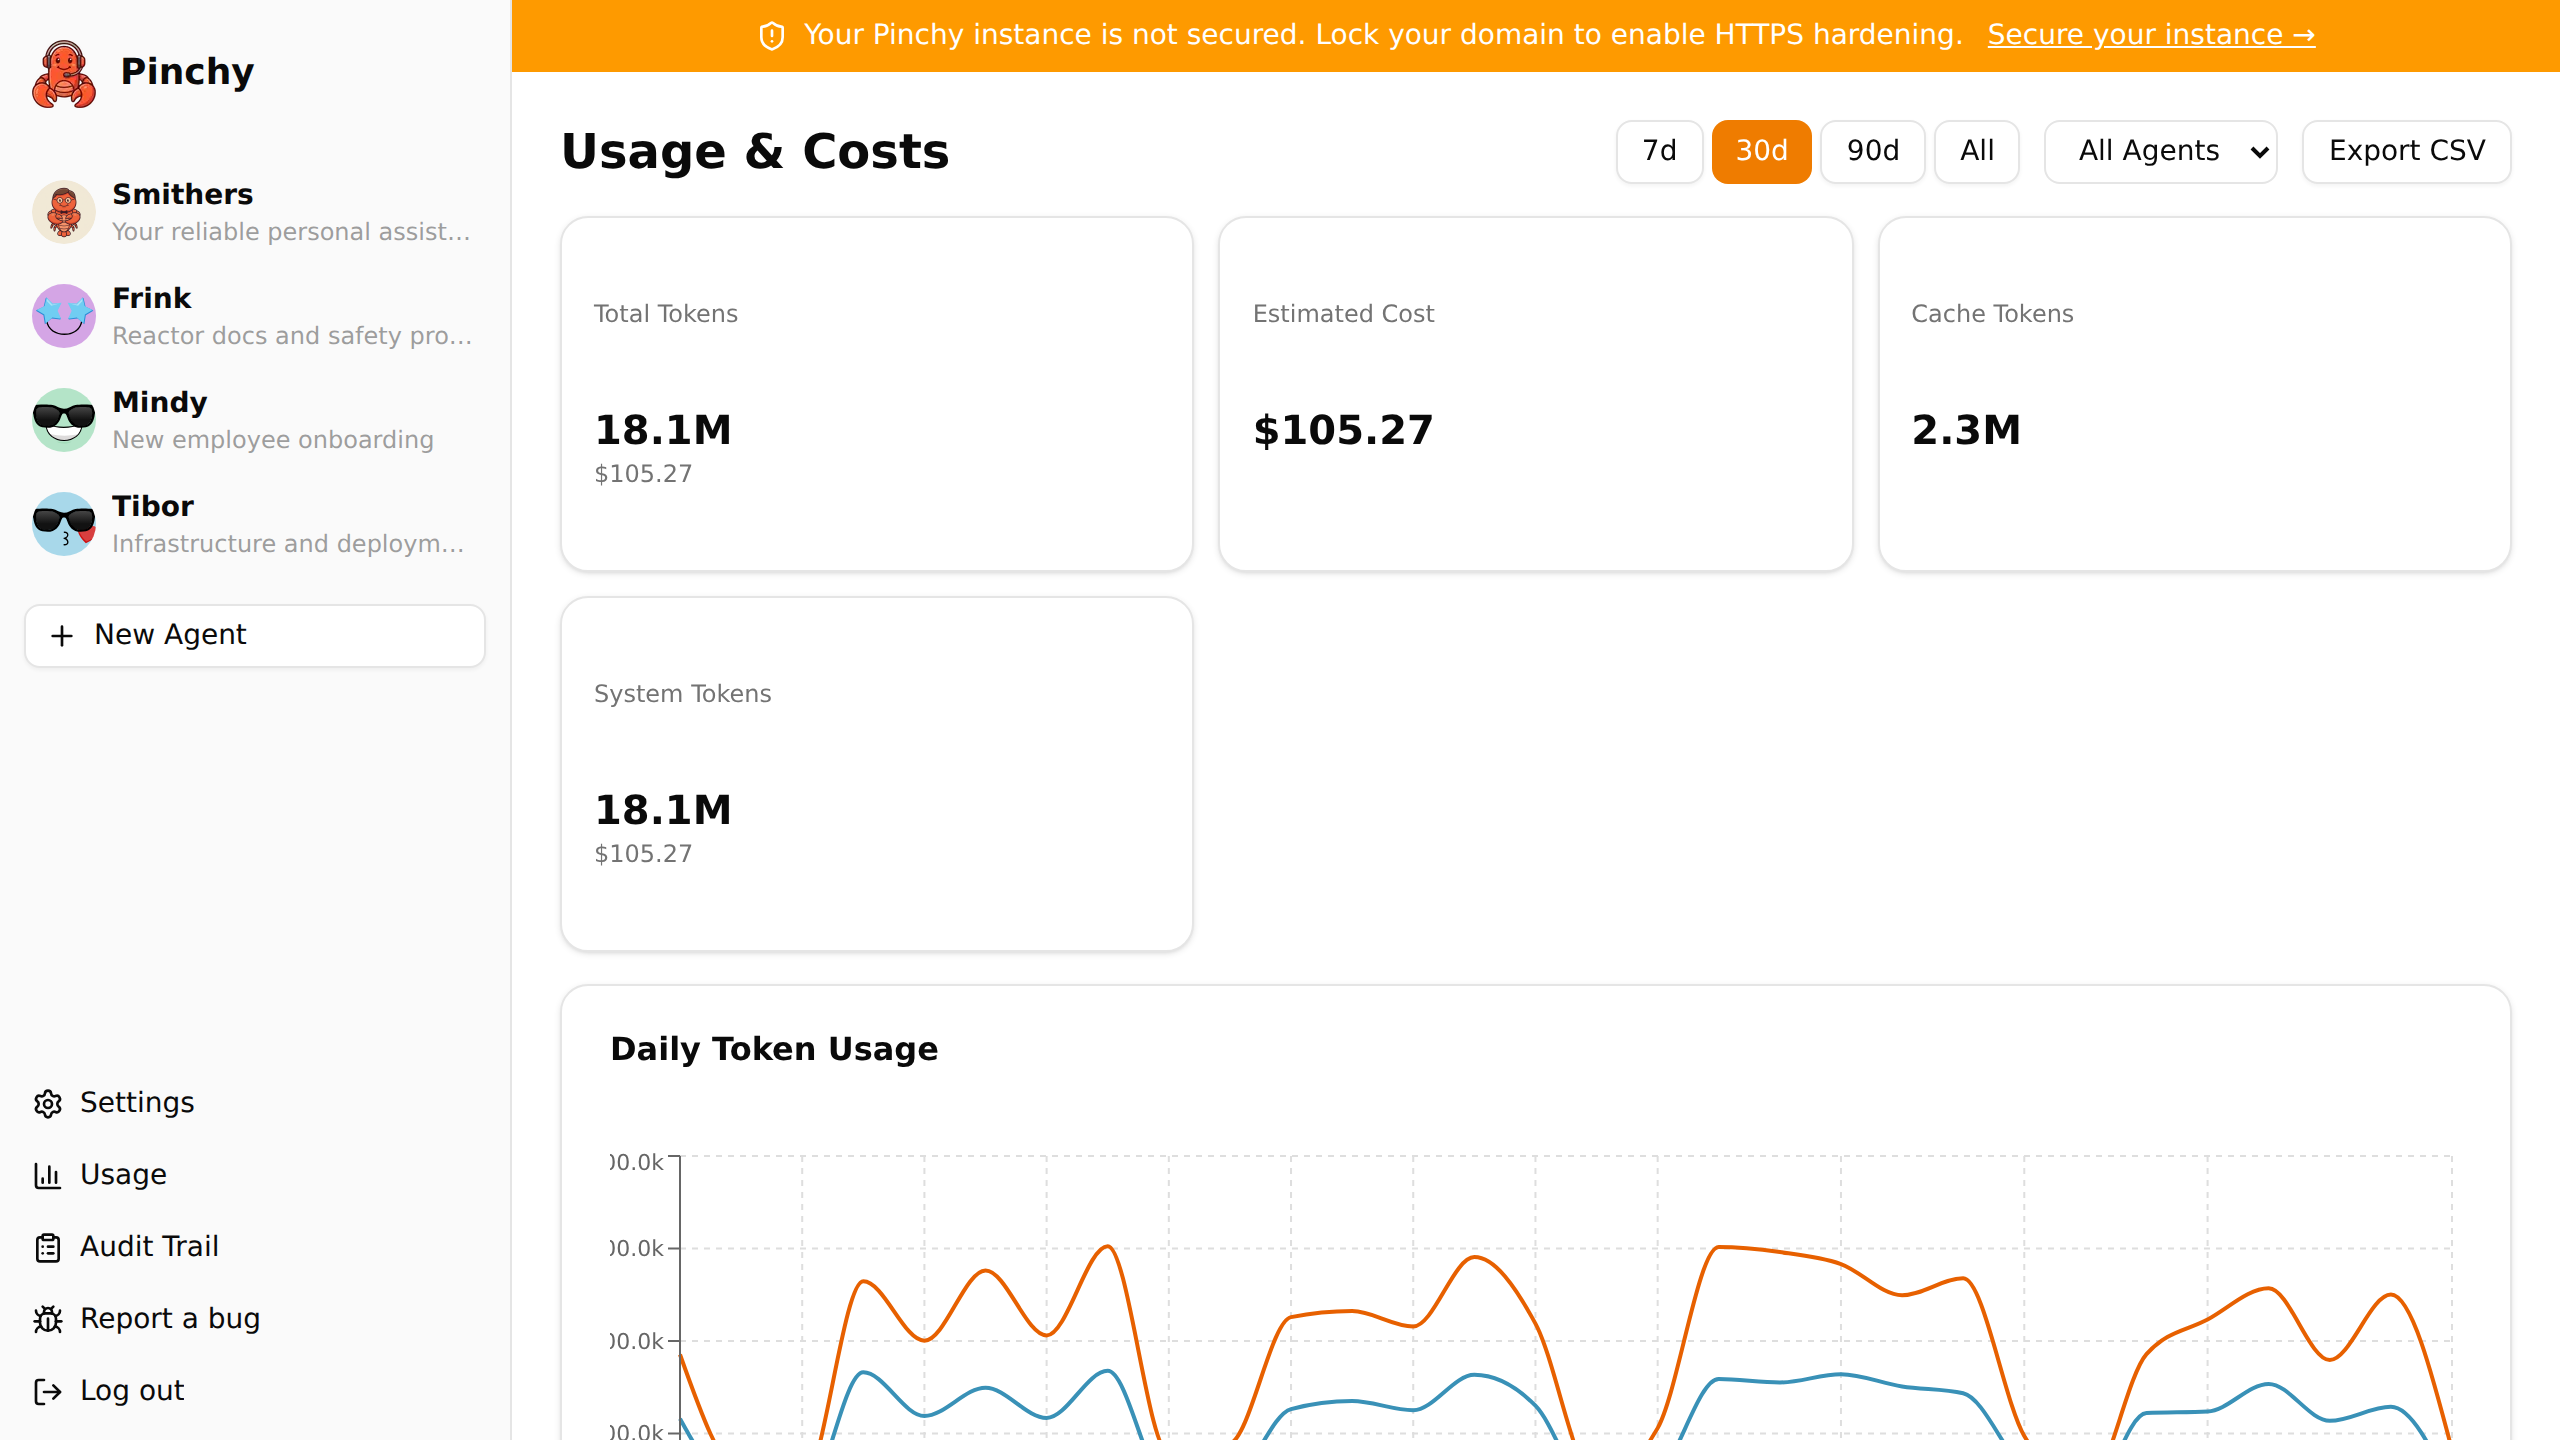
Open Usage from the sidebar (or visit /usage).
- Total Tokens — sum of input and output tokens for the selected period and agent filter
- Estimated Cost — running USD estimate based on the per-token prices in your provider's model config. Shows "—" when pricing is unavailable (e.g. local Ollama models) so you can tell the difference between "free" and "no pricing data"
- Cache Tokens — combined cache read and write tokens, shown when cache usage exists. Cache tokens reduce costs (reads are cheaper than fresh input tokens) and this card helps you see how much you're saving
- Source Breakdown — how those tokens split across Chat, System, and Plugin use (see below)
- Daily Token Usage chart — input, output, and cached input tokens over time (the dashed Cached Input line combines cache reads and writes; with providers that cache aggressively it usually dwarfs the uncached input). Days with no usage show as zero instead of being skipped, so you see actual gaps rather than misleading interpolation. The chart groups days by your browser's timezone, not UTC
- Per-Agent Breakdown — which agents consume what, sorted by cost. Deleted agents are marked with "(deleted)" so you can still see their historical usage
- Per-User Breakdown Enterprise — same numbers split by who chatted with the agent
Token sources
Section titled “Token sources”Not every token an agent burns comes from a user message. Pinchy labels each usage record with its source so you can see where the budget actually goes:
- Chat — tokens spent on direct conversations with the agent (user messages and the agent's replies).
- System — tokens spent on background work Pinchy triggers on the agent's behalf, such as onboarding interviews or scheduled jobs. No human sent these messages.
- Plugin — tokens spent inside a tool call. For example, when an agent asks the
pinchy-filesplugin to read a PDF, the plugin may call a vision model to extract text from scanned pages. Those vision calls are billed to the agent but show up under Plugin, not Chat.
The breakdown only appears once at least two sources have non-zero usage — a lone card (for example "Chat" before any background or plugin work kicks in) would just repeat the Total Tokens figure, so Pinchy hides it until the split actually tells you something. Each card then shows only the buckets that have usage.
Filters
Section titled “Filters”- Time period: 7 days, 30 days, 90 days, or all time
- Agent: drill down to a single agent, or look at the whole fleet
Both filters apply to every card and tab on the page.
Where the numbers come from
Section titled “Where the numbers come from”Pinchy writes a usage record whenever an LLM call completes. Agent chat turns are recorded individually and exactly — each turn's OpenClaw trajectory entry carries that turn's precise tokens, so Pinchy records one row per turn (deduplicated, so restarts and retries never double-count). System usage (scheduled tasks, channel bots) and plugin-internal LLM calls (e.g. a plugin transcoding a scanned PDF) are captured separately — the former sampled from OpenClaw's per-session counters, the latter reported directly by the plugin. Each record carries the input/output tokens the provider reported, plus cache read and write tokens when the provider supports prompt caching.
Pinchy multiplies those by the per-million-token prices configured for the model and stores the result in USD with six decimals. Cache tokens use Anthropic-style pricing ratios: cache reads at 10% of the input price, cache writes at 125%.
A few honest caveats:
- It's an estimate. Provider invoices are the source of truth. Pinchy uses the prices baked into the OpenClaw model config, which can drift from a provider's current published rates.
- Cache pricing is approximate. The 10%/125% ratios match Anthropic's published pricing. If your provider uses different cache pricing, the estimate will be off.
- Chat token counts are exact, per turn. Each agent chat turn is recorded individually from its OpenClaw trajectory entry (the precise input/output/cache tokens that turn used), so nothing is dropped or double-counted even on busy sessions. System usage (scheduled tasks, channel bots) is still sampled from OpenClaw's per-session counters and can lag slightly.
- Local Ollama shows "—" for cost. Local models record token counts but have no pricing config. The dashboard shows a dash instead of $0.00 to make this clear.
- Tool execution time isn't tracked here. Only the LLM tokens count. The Audit Trail at
/auditis where you go for tool-use details.
Export Enterprise
Section titled “Export ”With an active Enterprise license, the Export CSV button (top-right) downloads the current view — period and agent filter applied — as a CSV file. The export includes cache read and write tokens alongside the regular token columns. Useful for finance hand-offs or feeding the data into your own dashboards.
Without a license, the button is disabled but stays visible so you know the feature exists.
What it can't do
Section titled “What it can't do”The dashboard answers "how much" and "by whom", not "for what". If you need to know which conversation burned through 50,000 tokens, that level of detail lives in the Audit Trail (/audit) — and even there, individual chat content is intentionally not logged. Pinchy treats chat messages as user data, not audit material.